Code
import numpy as np
import matplotlib.pyplot as plt

r = np.arange(0, 2, 0.01)
theta = 2 * np.pi * r
fig, ax = plt.subplots(subplot_kw={"projection": "polar"})
ax.plot(theta, r)
ax.set_rticks([0.5, 1, 1.5, 2])
ax.grid(True)
plt.show()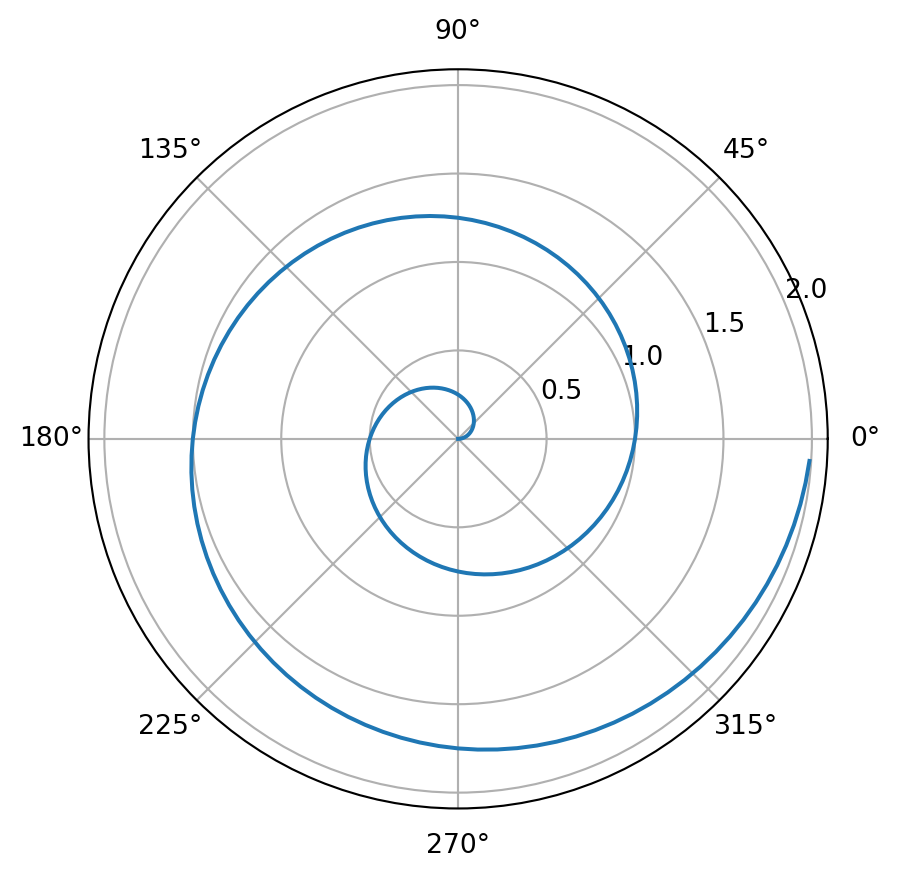
dataBiryani: name: Soumendra Dhanee title: Chief Scientist, Deep Learning @VJGroupInc url: https://github.com/soumendra image_url: https://github.com/soumendra.png
import numpy as np
import matplotlib.pyplot as plt
r = np.arange(0, 2, 0.01)
theta = 2 * np.pi * r
fig, ax = plt.subplots(subplot_kw={"projection": "polar"})
ax.plot(theta, r)
ax.set_rticks([0.5, 1, 1.5, 2])
ax.grid(True)
plt.show()Note that there are five types of callouts, including: note, tip, warning, caution, and important.